Lead Insights
- 27 Jan 2024
- 1 Minute to read
- Print
Lead Insights
- Updated on 27 Jan 2024
- 1 Minute to read
- Print
Article Summary
Share feedback
Thanks for sharing your feedback!
The Lead Insights page is used to help you understand the effectiveness of converting your leads to enrolled families. This screen has two sections: Pipeline and Funnel.
The 'Pipeline' table provides a snapshot of leads by status and allows you to compare data for two dates at a time.

The 'Funnel' table displays how leads move through the lead process, which includes the percentage of leads that convert from one status to the next (ex: Toured to Waitlisted), and the average time a lead spends in each status.

Date Range
Use the Date Range options to choose the range of dates you wish to view.
The 'Pipeline' table allows you to select two dates to compare the data. By default, the current date will display, along with the date 30 days prior.

The 'Funnel' table has the following date range options: 30 days, 3 months, 6 months, current year, and custom date range.
When choosing a custom range, select the start date, then select the end date. The date range will show in the Select Range field and the chosen dates will display in blue on the calendar view.

Table Filtering
Each table allows you to filter the lead data by status, room, and more!
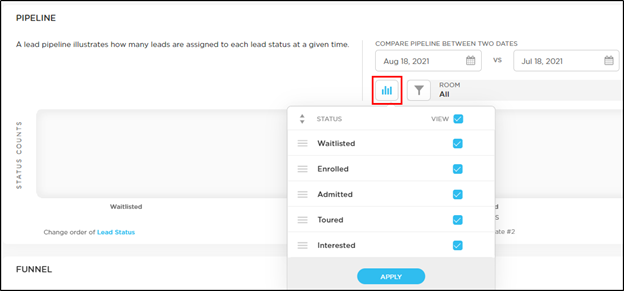
Both tables have a bar graph icon which allows you to choose which statuses you wish to view. You can check, un-check, and reorder the statuses from this icon.
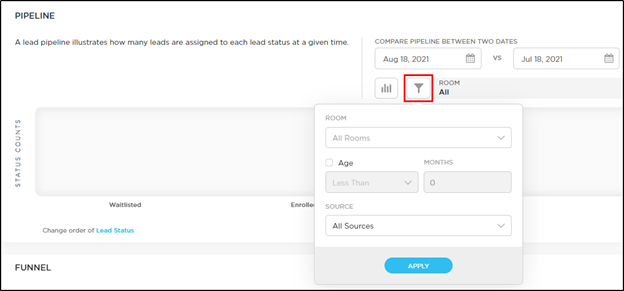
Use the funnel icon to filter the data by room, age, and source (event, internet, referral, etc.).
Was this article helpful?